Archives For author

When they say it’s hot in the desert, they mean it. When they say it gets cold at night in the desert, don’t be so sure of it: it is still hot at night (at least during the summer). When I bought my ticket to the desert, I had not read the part that said I would be driving 12 hours every day for the next 4 days in order to see the Sahara desert. The no refund policy of the ticket forced me to keep it. Little did I know that the daily 12 hours on the road would actually be a treat. When I first stepped out of the car in Marrakesh, Morocco, I thought I was standing next to a car’s engine. I came to realize the hot, dry air was actually coming up from the ground. It was 118 F that day. For a reason I don’t know the answer to, the sky in Morocco was grayish (but not like cloud gray, just a weird gray… look at the picture below), so you wouldn’t see the sun hitting you directly, but you could definitely feel it radiating back at you.

It was the month of Ramadan, and Morocco is not a secular country, so the arid heat would be further emphasized since you would have to wear pants and cover your shoulders (specially if you are a woman). You could feel the heat from the contact between your body and the fabric and the retention of it in the space in between slowly doze your brain off as the surrounding heat and objects would speed up the process of making you border a state of unconsciousness.

In the city, the structures’ tall roofs and cross ventilation helped to ease the heat and actually provided decent spaces to be in. People would gather in these spaces and wait for the day to pass on by ready for that moment, around 7 pm, when they could have water and food once again. To respect the culture and not offend anybody, we would also tried to abide by the rules of no drinking or eating during the day. It was as if we were part of the culture but we were definitely not like them: we are used to having regulated comfort zone temperatures and dress according to weather. In Morocco, we were far from the comfort zone and wearing the same amount of clothes we would wear in Fall. Culture shock was thus highlighted with thermal shock. It wasn’t necessarily a bad thing though, it in fact was very interesting and provoked a feeling of admiration and respect towards the culture (none of them complained about the heat or lack of water/food).

Back in the car, you could feel a stark contrast between the heat coming in through the windows and the cool air coming from the air conditioner. The effect would be that half of your body was really warm, and the other half, the one facing the air vent, would be cooled down. This imbalance would occasionally make you break into a sweat (because we weren’t drinking water, we didn’t even have enough fluids in our body to sweat the entire time).

Once in the desert, there was not escaping the heat. The breeze would do nothing but move the sand grains a couple of feet every so often. Never in my life have I felt such hot dry air. I am really grateful it was dry, I think I could have died if it was that hot and humid at the same time. What was really interesting, pretty obvious but not something you usually think about, was that the sand dunes would be unbearably hot on one side, perfectly divided by a continuous flowing line, and cool on the other depending on the sun’s position. If you touched this dividing line, you would feel it hot on one side and cool on the other. We therefore set up our camp on the “cool” side of the dunes, where the sand was nice to touch.

I had packed a pant and a long sleeve shirt to sleep in because “the desert gets cold at night”. But no, it did not. Even though you didn’t have the feeling of the sun’s rays attacking you directly, the place was still very hot. The sand was the only thing you could feel a significant difference in terms of temperature. The tents were unbearably hot. To be able to sleep, we had some red wine, the only drink that could be tolerably drinkable if hot, and moved the sleeping bags out of the tents (and slept on top of it, not in it). This way, the coolness of the sand made it decent enough to be able to fall asleep.

Now, this is what was actually happening in the Sahara: first of all, we all knew we were in the desert; seeing camels and sand dunes psychologically already created an inescapable perception of terrible heat way beyond our control. Secondly, you get little interception of the sun’s radiation since there is technically nothing (no shadows, no structures, no nothing really) so the ground is in almost direct contact with it (“almost” because of what is absorbed by the atmosphere, what is reflected back etc). The heat absorbed by the ground is then transferred into the air by conduction, which then moves on up through convection, ultimately heating up the entire place. In the Sahara’s dunes, the only thing there is is sand (and a few rocks scattered around almost never). The sand’s grains are so thin and dry that the capacity of heat retention is very low. Because of this, the sand heats up / cools down faster. This explains why the difference in temperature in each side of the dune (at certain times of day) is so dramatic. This also explains why the sand is unbearably hot during the day and cool at night. (The sand’s low retention capacity might also be why it was still hot at night – it releases all of the heat contained in it into the air, keeping it hot).

Overall, being in the desert is definitely terribly hot, but the experience is amazing and really a once in a lifetime thing (I don’t think I’d do it again). In the morning during sunrise, the sand was nice to sit on but faster than what you’d expect it started getting hot again – so we packed and left the incredible Sahara desert.

Sunrise at the desert:

Sources:

http://www.survivalebooks.com/13.htm

Lately in class we have been going over human comfort and its importance in design strategies. It is understood human comfort is taken from an average of a population and is thus a general measurement that encompasses a set of ranges. We have also learned that there are several things that affect human comfort (see this graph) and that things “radiate” heat at different levels; some materials retain more heat than others, some conduct temperature more effectively etc. Because of this, we usually create artificial systems that will adjust a specific relative humidity and temperature to create an “atmosphere” we are comfortable in (air conditioning, heat generators etc). Since these artificial systems require a lot of energy, as architects it is our job to design structures that will enhance conditions to be as close to human comfort range as can be possible (for instance, you wouldn’t really want a plain concrete-slab house – if not well insulated, of course – in Alaska; it would make your house really cold and your electricity bill go up). You wouldn’t move a beach house in Cancun to Boston either (seems obvious, doesn’t it?)

Then the questions is, why do food chains look the same everywhere? Why does a McDonald’s in Nicaragua look the same as a McDonald’s in  Alaska? I know this is because it is an image that they are maintaining, so that it is easy to recognize it wherever you go. However, what role does this play in terms of human comfort? Is it efficient to have the same window size in Nicaragua than in Alaska? I refuse to believe that one cannot maintain the same image if the architecture changes. Where are the architects when designing a McDonalds? Is McDonald’s really not planning to invest a little more to hire an architect at least for each climatic region to adjust to the structure to the environment while maintaining the same image?

One can only wonder how much energy would be saved if each McDonald’s in the world was designed with its environment in mind and not simply “copy – pasting” the same model all over the world.

Suddenly, for an unknown reason, there is a displaced population in the borders of the Pacuare river in Costa Rica that was been denied access to contemporary energy infrastructure!  There are so many basic things they need, such as shelter, cooling, food, and lighting. In Pacuare, the temperature is tropical and doesn’t vary during seasons. Day temperature is usually hot and humidity is high (“ranging in the 80’s“); at night, temperature goes down just a little but nothing too significant. (This means that the population will be very grateful if they have a source of cooling taken into consideration as part of their needs).

The river’s current is wildly running before them… What to do? Well, convert the river’s potential energy into kinetic energy. The solution: watermills.

Watermills are capable of fulfulling so many different basic functions efficiently, such as those needed by a displaced population in catastrophe, it is surprising to believe they are mostly only part of the past (check out a brief history). Therefore, for this assignment I used these models of the past as a foundation and developed a system for this population in which food, energy, comfort, and income are addressed (even though lumber production is mentioned as one of the things a watermill is capable of, I left this one out to address other issues).

In terms of food, people will be able to grind flour, corn, grits, or any other grain that they may need to grind to produce food (which they can sell to generate an income) based on the old model in which a turbine was used to grind grains. A large water turbine is in contact with the Pacuare river, whose strong current will make the turbine rotate, which will rotate other gear-like turbines that will “power up” the food grinder (note that the basic model of grinding relies on rotation and contact – hence, the 2 “blocks” of the basic model). This same turbine rotates another set of gears that are connected to an energy generator that will store the energy in a battery (adapted from this model), working as a hydroelectric powerplant. With this, the population will be provided with a small amount of electric energy that they may use to their convenience (be it lights, phone charging, or cooking with an electric stove).

As for cooling, the shelter uses a very simplified open system of cross-ventilation and a vent for hot air to exit. To continue using the potential energy of the river, I created two smaller turbines that will rotate 2 fans that will enhance cross-ventilation in the more closed off area of the shelter, becoming a cooling spot.

If this seems to make no sense at all, look at the system:

In case you are wondering why the shelter is divided into 2 spaces, I did this for 2  reasons:

One is because one is more of a work space than a “home”/shelter space and the second is because I can imagine the generator and the food grinder will create at least some heat – which is best separated from the actual shelter space (where the battery is located and activities such as charging a phone or cooking may occur, resembling more of a home space).

Overall, this is a solution to the population in catastrophe that attempts to “kill more than one bird with a single bullet”.

Other sources not linked above:

http://bakerblockmuseum.org/heritage/gristmill/gristmill.htm

http://www.britannica.com/EBchecked/topic/382923/milling

Sometimes when we think about efficiency and green building, we get caught up in complex systems and expensive technologies. Because of this, we forget we can address such issues using basic and simple techniques. One of our biggest concerns nowadays is the large amount of energy consumption in buildings. We had previously talked in class about the use of air conditioning and its inefficiency. However, since the discussion session ended, we have pushed this idea to the back of our minds.

For the purpose of simplifying this blog and any complex method that may emerge as an attempt to reduce energy consumption, I would like to bring the issue up again. Reducing energy consumption in buildings is not about changing human comfort zones and turning the air conditioning system off, it is more about changing our design method. The usual thick rectangular configuration of buildings must be left behind in order to adapt a natural system of ventilation.

Cross ventilation is a pretty simple concept that should be employed as part of building design. Even though its application probably means it will take more time to properly design the structure, the results it yields if well made are worth it. One of Germany’s most “innovative green buildings” is the GSW Headquarters in Berlin; the structure was completed in 1999 – one can see how some of the techniques, as is the case with cross ventilation, used more than a decade ago are still more functional than other modern more complex systems (after 10 years it is still working). In this building one can appreciate (see image) the role the placement of an envelope on the façade has on the building’s overall efficiency; the structure uses a “passive ventilation system”. The windows are also operable, a factor than increases human comfort since it makes people feel like they are in control (according to “Ecology Design Synthesis”).

What is interesting about this is that it is a renovation. One can only begin to wonder why aren’t buildings that are highly occupied also renovating? After all, in the long run these renovations will account for savings.

I guess it all comes down (apart form short term economic obstacles) to being stubborn. It is hard for contemporary human beings to change routines or what we are used to. Even though the weather outside is great, you get little or no people opening their windows. I know I open mine just because I like colder temperatures than what my roommates do, but not because I’m trying to save energy, so I can’t really judge.

The first TV commercial in which the iPad was shown (First iPad commercial) depicted the small tablet swiftly fulfilling several different functions varying from reading a book, checking emails, picture storage, and article reading: activities which one can quickly relate to. All of these activities are part of the 21st century population’s routine. Isn’t it great, then, to have them all so easily accessible in this sleek, modern high tech device? Besides its convenient size, you need nothing but your fingers to use it. Wonderful. The idea that you might need this has been planted in your head (yet you don’t know its greed).

The apps boom then catalyzed the market of the iPad. You could now begin to download apps that fulfilled and managed other basic necessities relating to school and many other areas. For instance, there is the iPad educational apps database (Apple Educational Apps) in which there are thousands of apps in which one can do things varying from math homework to taking notes to studying for a test.

Ok, so now the iPad does everything you usually do but within a single device. Everybody starts buying them and start “saving time”! (“Saving time” because it has the potential to do this, but because of its other functions, you actually spend of lot of time doing nothing productive – the reality not shown in the commercials). You are then at a “disadvantage” in contrast to all iPad owners and their “efficient activity management”. Now you need it (at least that is what you’ve been manipulated into believing). You buy it.

However, do you really need it? When do things evolve from greed to need? Is it really because everybody starts having/doing things that they become necessities?

I believe the question is too ambiguous, but I think the answer is more a yes than a no. The iPad is just one of the several examples that follow this sort of behavior. Because the iPad is something relatively new, it is not clear yet if it will become a necessity over time. Think about this in terms of architecture: no architecture firm will hire you if you tell them you don’t know how to use Rhino, AutoCAD, Grasshopper, MicroStation, Sketch up, Maxwell, Flamingo etc. (not saying that you need to know how to use all of them, but just in general you need to know some of them). The reality of these programs is that they began as objects of greed (facilitating design) but are now necessities. They are objects of greed because they were not needed before, thus, they are a created necessity. I feel safe to say that 99% of the buildings in the world used none of these programs to be designed.

One can look at Gaudi’s Sagrada Familia as an example: its highly ornamented design is extremely complex yet Gaudi follows a certain set of logics for its composition. He used no computer to design it and computers were not used until just recently to accelerate its construction and understand its logic. Through computer modeling, a complex definition was made to model Gaudi’s column’s design. This example demonstrates how things could be created just as well before the greed became a need. (Parametric Case Study of Gaudi’s Columns)

Overall, by looking closer into these systems of manipulation and transformation of greed to need, one can use similar strategies and apply them to improve existing systems such as those of sustainability. If one could find a method of marketing sustainability in a similar way that the iPad was marketed in which an established trend develops into a necessity, one could restructure human behavior and improve sustainable practices. One should not only think in systems but also be able to extract behaviors from systems, such as human manipulation, and see how one can apply the same dynamics to other systems and test results to see if they work.

By the way, something amusing that I noticed from the commercial, if you pay close attention you can see that the person holding the iPad is a couch potato: always sitting down (even though this references a relaxed, easier lifestyle, in real life its more or like the amount of time one wastes using items such as iPads).

List all stakeholders whom you believe impact the sustainability of the Chesapeake Bay.

Population:

  • Farmers
    • Crop
    • Animal
  • Watermen
  • Industries
  • Land Developers
  • Government
      • Crop Regulators
      • Land Use Regulators
      • Livestock Regulators

List all non-human factors you believe impact the sustainability of the Chesapeake Bay.

  • Nutrient cycles
  • Climatic cycles
  • Natural disasters
  • Rivers (Potomac, James, etc)
  • Water currents
  • Invasive species
  • Ecosystem
  • Food production

Explain the interactions that occur among the stakeholders and factors you listed that lead to varying levels of sustainability-related outcomes

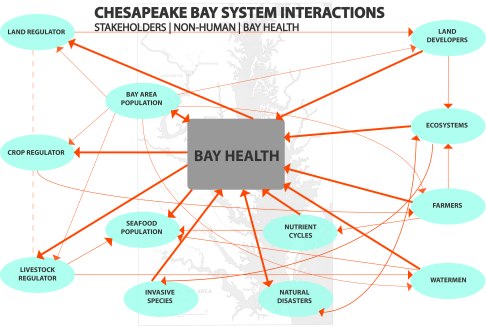
The interactions between the stakeholders and factors listed for the Bay Games depict a complex connectivity amongst them in which one thing affects the other and so on – sort of like a domino effect. First of all, the health of the Bay is to be blamed on population: human decision is the overall driving force of this system (even some natural disasters are product of human activity). Population activity is controlled by the Government which sets regulations on how things are to be used – thus, you have the regulator stakeholders (land regulator, crop regulator, and livestock regulator). These regulations are based on economic interests, biological matters (ex. Large depletion of fish will lead to a regulation on how much fish a fisher can catch), and social (demand etc.) factors. The regulators’ mission is to feed off of the status of the Bay’s health to maintain some sort of equilibrium between human activity and resources (yet because of economic interests there usually is no equilibrium and sustainability fails). Therefore, these regulators affect the activities of another set of stakeholders: land developers, farmers, and watermen – who directly affect the Bay’s Health since they are disrupting the natural world. These disruptions create changes in the ecosystem (climatic conditions etc.) which give rise to invasive species as well as natural disasters that continue to create disruptions in the Bay’s Health = changing regulations and affecting watermen, farmers, and land developers. One can further zoom into some details such as nutrient cycles (affected by run-off, erosion, overproduction, depletion of nutrients etc.) that affect farmers and seafood population that will again affect the Bay’s Health. As can be seen, it is a never ending chain reaction between stakeholders, nonhuman factors, and the Bay’s Health. Each individual decision is regulated by the Government which in turn tries to stabilize all decisions, yet usually due to economic matters, there are many fallacies in the system that results in the varying levels of sustainability issues.

Using the examples of systems diagrams from Thinking in Systems and the lectures, draw a diagram of the components of and relationships between the human and natural systems that you outlined above.  The connections may take the form of feedback loops that either reinforce or stabilize certain relationships. Include environmental processes, the role of decision makers, and interactions that you see as critical to the economic and environmental indicators.

Image

This first diagram is a general overview of the behaviors that I could extract from my studies of the Bay Games. It is very broad and meant to demonstrate a large scope interrelated system of behaviors.

Image

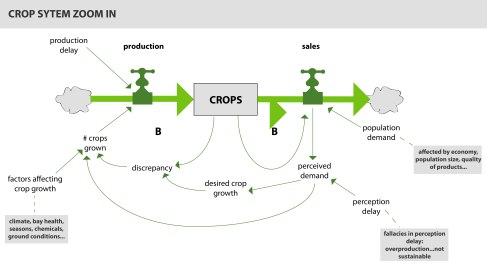
The crop diagram is a small scope example of how each thing demonstrated in the larger scope diagram is a system in itself. The idea is to demonstrate the complexity of the system and relate to the concepts from Meadow’s readings.

In a short paragraph, describe an experience that you had during the game play that led to a new insight about the system or a deeper understanding of the processes at work.

Even though I did not have the opportunity to be present in class and participate in the Bay Games, I was able to involve myself in the project through the UVA Bay Games webpage and by talking to my peers. I believe that the best experience one can attain from projects like this is the insight of observing the results of decision making as a stakeholder – that is placing oneself within the system and becoming familiarized with the situation – and the actual impact that they have as they relate to other factors within the system. By viewing the direct results of one’s actions in relation to other factors, it is easier to become more concerned and involved with the functioning of the system and best sustainable approach since one can truly begin to understand how one behavior dictates the other and which one is more effective/successful. With this insight on the system, one becomes more capable of interacting with it and its dynamics in order to work with it to promote efficiency of the system and improve matters of sustainability on the Bay. Observing a system from the outside is in many cases not enough, especially in cases like this in which each stakeholder has different necessities and stance on the situation.

The Bay Game includes a limited set of tools for the policy makers and other roles to change the dynamics of the model.  Imagine and describe a real-world strategy to improve bay health through behavior change, market strategy, policy or player choice.  Think about the systems leverage points from Meadows as suggestions for changing system behavior – you may either invent a strategy or describe how a similar strategy was used in another circumstance.  How would your idea potentially affect the behavior of the economic and environmental models that the game is based on?

I believe that the best way to improve the system on the Bay is to change the way human beings operate (the government, economic structure etc.) and create a redistribution of stocks and stakeholders in which all systems are handled according to each particular system’s needs and not individual needs. However, the restructuring of this would be an idea based too much on the destruction of capitalism and concept of utopia. What I mean to say by this is that the case usually is that economics are placed first before sustainability. This attitude is something nobody can deny; for instance, a farmer will continue to farm to feed his family even if it means he is depleting his soil of nutrients, causing erosion and ultimately affecting the health of the Bay. The necessities created by unbalanced methods of resource management forces people into making irrational decisions that result in a moment’s peak growth and then long term downfall, overall affecting sustainability. Many of Meadow’ models demonstrate this sort of behavior – reason why balancing loops are required and leverage points found. One can look at the oil example in which the rapid increase of capital creates more investment which increases the amount of oil extracted and so on until depletion is rapidly reached and the system crashes. It is not so different in the Bay example since even though the government is supposed to place restrictions, individuals are still guided by personal need (because of this individual interest, it becomes difficult to understand which factors to address in order to improve issues of sustainability in the Bay.)

Overall, I believe that if I had been able to participate in the class Bay Games, I might have had a more specific approach towards how these behaviors could be modified in order to best develop a method that was not so theoretical but rather more operational. Other than that, I do believe that sustainability issues have a lot to do with the structure of capitalism.

We are improving the UVA Bay Game with each game play and would like your feedback. Please share any thoughts you have on how the game could be better, what you liked, how it could be best used, and any other comments you have.

I think that the UVA Bay Games is very well organized and is a great program in itself. I am glad to say I first found out about it through a commercial during a football match. However, the down side of that is that I was in no way encouraged to even try to find out what it truly was. To be honest, if it weren’t for this class I would have never looked into it – nobody else who was watching the game with me when the commercial first came up has bothered to look into it. Because of this, and human being’s greedy nature, I think that promoting it is not enough and that if there were some sort of incentive for participating (other than helping the world), the UVA Bay Games would have a bigger audience.

One of my classmates sent me the following 3 questions and told me we were supposed to answer them in 5 minutes. Following the same instructions, I did this make-up of the in class assignment:

1.1     List all stakeholders whom you believe impact the sustainability of the Chesapeake Bay

I believe the stakeholders that would impact the Chesapeake are farmers, land regulators, industries, residents, real estate developers, bay regulators, watermen, crop regulators, and animal regulators.

1.2 List all non-human factors you believe impact the sustainability of the Chesapeake Bay.

Weather, water currents carrying pollutants from other areas, chemicals, bacteria, ecosystems, and other natural disasters caused by global warming.

1.3 Explain the interactions that occur among the stakeholders and factors you listed that lead to varying levels of sustainability-related outcomes.

All of the stakeholders and factors are related since the stakeholders make use of the non-human elements and are directly affected by them and vice versa. For instance, weather conditions such as rain can cause erosion which depletes the soil from its natural minerals provoking the use of fertilizers in farms which will then increase toxics in the water which will affect the fishermen and the bay’s sustainability in general. One change in one element or stakeholder will affect another one and so on.  

My first thought towards Donatella Meadows’ “Thinking in System” was that it is amusing to write a book on thinking in Systems. I really wonder if there is any other possible way to think that is not in systems. I came to think about this reading, however, as not about trying to tell us that we should think in systems, but rather the realization that we already think and live in systems yet usually fail to develop the capability of concretizing the concepts in our head in a coherent way – which usually leads to the failure of comprehending the overall behaviors and nature of the system (of course, depending on the complexity of it). As architecture students, specially in the global warming/economic crisis context in which we are found, it is imperative to be able to develop this skill and apply it to our design strategies so we can interact with systems modifying them to improve efficiency: ultimately avoiding the vicious cycle of being vague and inefficient.

We all think in systems even if we don’t think we do; we all understand the model of A + B = C and C – A = B etc. even if we don’t graphically have it represented that way in our head. For instance, we all know how a tub works: somewhere in our unconscious mind we all have the system diagramed when we decide to take a bath: closed drain + open faucet = full tub… It would even be kind of dumb having to map this diagram out when you decide to take a bath. Based on this, you could then ask why even bother reading a teaching of thinking in systems if you know we already think this way. Once again the answer is the same as what is stated above: because that information stored in the unconscious or conscious floating pool of ideas in our mind is not concretized and thus the behaviors of the system might be taken for granted, ignored, or misunderstood – meaning that we can’t use the systems to our advantage and improve them (which really is the purpose of this class).

The effects of the mapped out system vs. the un-concretized ideas in our minds is something one can experiment with to be able to grasp the importance of clarifying a system. For instance, ask yourself what would happen if the vicious cycle of the “all nighter”, something us as architecture students commonly experience, were concretized and placed all over the A-School? What if the system of the all nighter was developed and presented to us? We all understand how an all nighter works since we have all had one (at least nearly had one during charette week), but do we really understand the relationship between these behaviors? Look at the following chart:

By observing this, one can begin to see the behaviors of the system and therefore avoid falling into this vicious cycle, and maybe even the allnighter itself, by understanding the behaviors – ultimately improving efficiency. By mapping it out, one can begin to truly see/understand what we already know and thus be able to interact with the system. In this case, procrastination leads to a set back in time, which means you will have less time to sleep, which reduces efficiency; because of necessity and in many cases procrastination, you then take a coffee break (also a set-back in time, there is less sleep – less efficient – but still there is work to be done), which gives you an energy peak were you might work for a while but then you crash… once again you are less efficient and go back to square 1: work that needs to be done.

So what is the point…? The point is that what is important from “Thinking in Systems” is clarifying knowledge so that we can understand systems and interact with their dynamics. By making a graph of the all nighter, you can modify the system because you are observing the behaviors, so in this case you can maybe decide go to sleep instead of procrastinate so that you are more efficient when you get to work as opposed to falling back into the vicious cycle of the all nighter.

After understanding the importance of concretizing behaviors of systems and clarifying their relationships (extracting things from our floating pool of thoughts), one can then begin to apply the different system models explained by Meadows more effectively to be able to interact with a system and apply it to architecture for the purpose of maximizing efficiency – be it in your building or in avoiding the vicious cycle of the all nighter. If we fail to do this, we will be failing as architects since many issues that need to be addressed will be ignored due to lack of attention and care towards the various systems and their behaviors that are required in building strategies. We cannot claim a building as successful if we do not understand its behaviors and its dynamics.

Image


Basing off the comments received from the first iteration of this assignment, I realized “I think this is what it should look like” proportions were not the best way to address the issues at hand. After all, “this is what I think they should look like” sometimes (by that I mean all the times) fails to show actual relationships at some point.

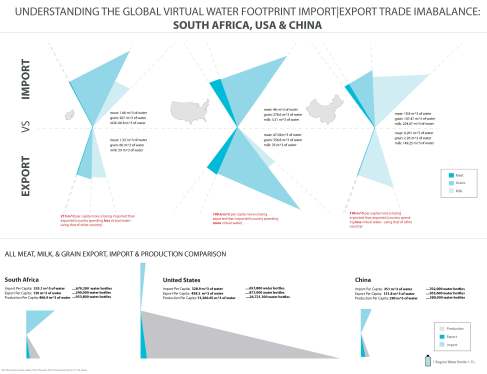
Even though my past iteration focused on the country’s overall import and export, I realized this is a little unfair considering that there is a huge difference between the population size in China vs South Africa (or any country vs China for that matter). Because of this, I broke down the numbers and calculated the import|export virtual water per capita of each country.

In order to get actual proportions, I decided to be honest with myself and find a method in which the actual numbers could be used to depict actual proportions. After an endless night of struggling with my mathematically retarded head, I realized the only way I could work with numbers that would actually work (due to the HUGE difference between import and export ratios amongst countries – and in some cases within the country) so that they could be put into Rhino without crashing my computer was to convert all virtual water values into m^3/ton – this provided reasonable numbers to work with.

I then decided to use the value of the virtual water for import and export as the area for a geometrical figure that I could then type up in Rhino and get results. As can be seen, the chosen geometrical figure is a triangle (Why? Because I wanted to. Just kidding. Squares or rectangles wouldn’t represent the conflicting forces between import and export of the countries as one pushing against the other as a triangle can when one is inverted on top of the other. Also, a triangle’s area is easy to find: a = b*h/2, meaning I just needed to find a height that could be used for all virtual waters – one that could divide both the smallest and the largest virtual water per capita with numbers that could actually be used to make a triangle. *note that the “just”, as it usually is for ALL architecture classes assignments, means this took hours to find/do).

I found that using 20 as a height was good enough (the lowest value resulting as 0.03 – China’s meat export, and the highest being 35.7 – USA’s grain export). To represent the information, as can be seen, the information is divided with import on top (coming into the country) and export on the bottom (coming out), and each triangle is color coded to show which product it represents (meat, milk, or grain). The country responsible for each virtual water import|export comparison is placed next to the visual representation in the actual proportion of the country – just to get an idea of importing and exporting per capita as relative to actual country size. Even though the diagrams are not as obvious as I was hoping them to be with the real proportions, the fact is that the US exports more than what it imports, South Africa is a little more of an importer than an exporter  while China does the opposite of the US – something one could see as a deficit: the US is using more of its virtual water when exporting while China, as an importer, uses some other country’s virtual water when importing.

At the bottom of the “divided between products” virtual water diagram, I decided to follow on this idea of  “using another country’s virtual water” so I included a diagram that would demonstrate the virtual water being used in each country for the 3 products (production and export) vs the import of virtual water on those 3 products (import) *(and yes, I do understand that there is virtual water involved in the transportation of products to import them, however, it is just viewing the situation through a different perspective). In this diagram, one can observe the ridiculously huge difference of virtual water being used in the US for the 3 products per capita vs that being imported and vs that of China or South Africa. The disproportion between import and production virtual water is evidently most visible in the US, followed by South Africa which is a little more balanced, and finally China which is pretty balanced. The values of the yearly virtual water per capita is compared to the amount of regular water bottles (.5 liters) that would equal to in order  to get a grasp of what it truly means.

Overall, after seeing this, it is no surprise I gained 17 pounds when I first came to live in the US 2 years ago. It is also no surprise I loose weight when I go home and gain weight when I come back to the US. The US is a consumer country and its huge imbalance between import and export and the fact that it is the one with the biggest virtual water per capita amongst the three is very interesting. The country with the most balanced import vs export, China, is the one with the lowest virtual water per capita. Therefore, I cannot help but wonder what would happen to the US if a balance between import and export was achieved? (Is that even possible in a consumer country in which every time you go to a fast food place you are harassed with the question of super sizing your meal?)

Image


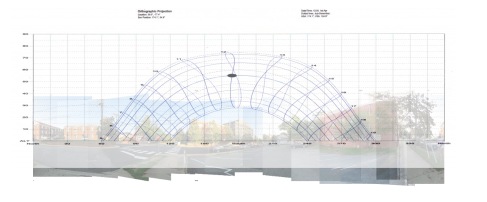
After making closer observations to my site, I noticed there were a few trees and a building which I had previously not taken into consideration. The corrections made have hopefully managed to track the path of the sun on my site correctly. A few adjustments were also made to the actual sun diagram.   

A. How many hours of sunlight does your site receive on March 21st?

Approximately 7:40 hours. My site’s direct sunlight is obstructed by a tree when the sun rises in March 21st at 7am. It starts receiving direct sunlight from around 7:30 am until almost 9 am, when it becomes obstructed by a few trees and a building until 10 am. From 10 am until around 4 pm in the afternoon my site receives sunlight before becomes obstructed by a building and a tree.

B. When does the sun first strike your site in December 21st? June 21st?

December 21st: 10 am. Because the sun’s rays are striking at such a low angle in the northern hemisphere during December, it is blocked by trees and a building until approximately 10 am.

June 21st: A little before 8 am. When it rises, it is obstructed by trees until it reaches an unobstructed spot near 8 am.

C. Which day of the year has the most sunlight on your site?

June 21st – sun rises at 5 am, is partially obstructed by trees in the morning and becomes blocked until around 4:00 pm by a building.

D. Where is the sun (altitude and azimuth) on August 15 at 3:00? Does it strike your site then?

Azimuth: 250-252

Altitude: 45

Yes, the sun is striking my site on August 15 until 4pm.

E. If you were creating a porch that would be warm in the winter and cool in the summer, how would you orient it on your site? Would this be possible on your site?

I would place my porch slightly North-East. In this location, the summer’s morning sun would be partially obstructed by the trees and building. The summer’s afternoon sun, because of the sun’s ray’s height during the summer, would be avoided directly and would hit the porch on the roof. During the winter, the morning sun would also be partially obstructed, however, sunlight (because of the low location of the sun) would be able to enter during the afternoon being able to warm the porch. A lot of how to create this efficient porch would depend on the shape of the roof in order to block direct sunlight during the summer’s afternoon (a tilted roof structure would work to allow low sunlight during the winter and block the summer’s high sunlight).  

F. Are there any notable features of your site that would influence the orientation, location of windows and shading devices?

My site would need shading devices from East – South, since it receives sunlight directly from this area during most of the day. The building located more towards the West blocks the sunlight usually after 4 pm so shading devices on this side would not be necessary and windows would be advisable on this side.